
It’s been a long time since I last work on any hobby project and update on my blog. Recently, I completed a mini project together with two of my friends. So I am going to take this opportunity to share the project that we have made, we named it the Bridge Monitoring System (BMS) using Wireless Sensor Network (WSN). We are required to design an embedded system that is related with disaster management, either mitigation, preparedness, response or rehabilitation. To give you a high level overview of this project, basically we created three sensor nodes that acquire sensor measurement and transmit to central hub through wireless network. The sensor network works in a many-to-one fashion and data processing is done on the central hub. All the sensor measurement from each node is also displayed on the Host PC for user interface. Therefore, in this article, I am going to walk through some details of the project and how it works.
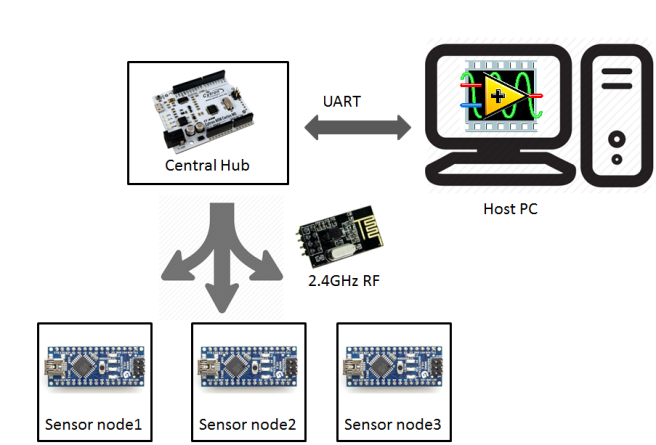
The figure above shows the high level block diagram of this system. There are three sensor nodes which are controlled by an Arduino Nano. Each sensor node are equipped with various sensors and they are exactly the same as other sensor node. All these sensor nodes will communicate with the central hub using the nRF24L01 wireless module. Sitting at the central hub is the CT-ARM, this is where all the sensor measurement are sent and processed. All the measurement obtained are also sent to a Host PC for display through UART communication. On the Host PC, LabVIEW is used to create a nice user interface to view all the sensor measurements.
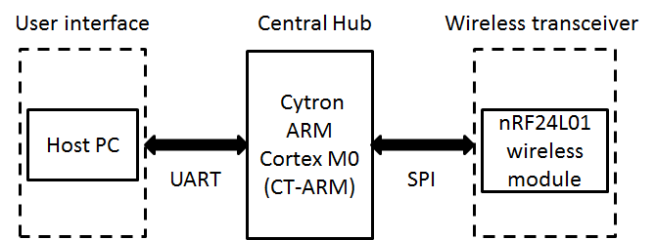
Let us look into more details for the central hub. As mentioned previously, the central hub is comprised of the Cytron ARM Cortex M0 (CT-ARM). CT-ARM is an Arduino compatible which uses the 32-bit Nuvoton NUC131LD2AE as the microcontroller. It operates at 50MHz clock speed, has 64KB Flash memory (twice of Arduino Nano) and 8KB SRAM (four times of Arduino Nano). CT-ARM is in charge to control and communicate the sensor nodes through wireless communication with nRF24L01 module. It is interfaced through the SPI communication. As mentioned previously, all the data acquired is sent to the Host PC through UART communication.

Next, the sensor node block diagram is presented here. The microcontroller used was the Arduino Nano which uses Atmega328P chip. There are three disaster monitoring at the sensor node, they are the bridge health monitoring, earthquake monitoring and sea level monitoring. Besides, there is also a simulated actuator, which is made up of a micro servo motor. Similar to the central hub, nRF24L01 module is used for the wireless communication.
Following next is the bridge structure monitoring, load cell is used to simulate sensors on bridge that is used to monitor any bridge structural change. This information can provide early information to the operator at base station about bridge health. The load cell is measured by the HX-711, a 24-bit ADC which is commonly used for weighing scale sensor. The voltage change of load cell with respect to the stress and strain is relatively small, this is why 24-bit ADC is required in this case. The Arduino interface with HX711 ADC through two wire interface (TWI).
Moving on is the earthquake monitoring, where the earth movement is measured by a three-axis accelerometer, ADXL335 from Analog Device. Instead of using the internal ADC of microcontroller, we are required to use an external ADC for measurement, in this case, TI ADS1115 16-bit ADC is used. This ADC provides four single ended input or can also be configured to dual differential input measurement. It uses the inter-integrated circuit (I2C) communication for configuration and data acquisition.
The third monitoring is more straightforward, which is the sea water level monitoring. Water level sensor is used to measure water level, which simulates any high rise/abnormal water level. This sensor is measured directly by the Arduino Nano internal ADC.
One of the challenging part for this project was to implement a many-to-one network topology among the sensor nodes and central hub. There are various wireless modules that are available such as Wifi, bluetooth, Zigbee and other RF module. The most suitable candidate would be Zigbee protocol as it can offer true mesh network. Xbee by Digi International offers variety of module with Zigbee protocol. However, they are too costly for this project, so other alternative has to be used. After some search, nRF24L01+ is selected as it is low cost and able to achieve tree topology network with the help from library. The RF24Network by tmrh20 plays an important role to make this networking happen.

The image above shows the network that can be achieved by the RF24Network library. Image credit to http://tmrh20.github.io/RF24Network/Tuning.html. A lot of useful information is available from tmrh20 github, so do check it out for more info. In this project, since there are only three sensor nodes, so only first level addressing is used. The central hub would be the CT-ARM while the end nodes are all the Arduino Nano.
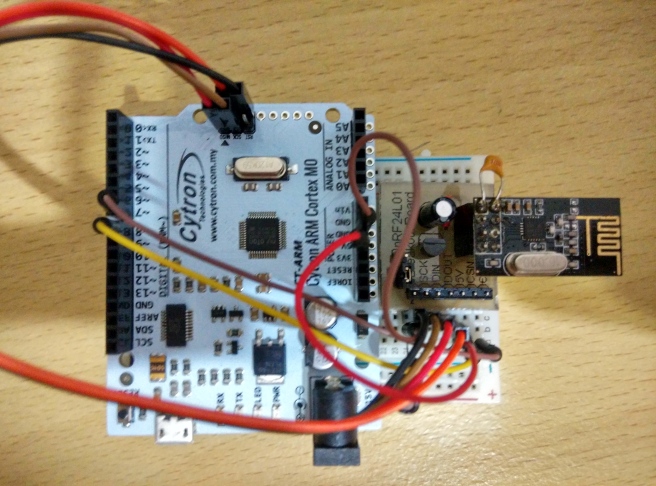
This was my first time hands on with nRF24L01+ module, a lot of time was spent to just make this thing work at the beginning. One of the important lesson learnt, which is also mentioned many time by other user, was the importance of decoupling cap. There is never too much of decoupling capacitor for this power sensitive module. I used the breakout board which I made long ago, check it out here. This breakout board has a 10uF electrolytic cap. I also manually soldered 0.1uF ceramic capacitor across the Vdd and GND on top of the module. With all these, I saved more time troubleshooting and focus on the programming.
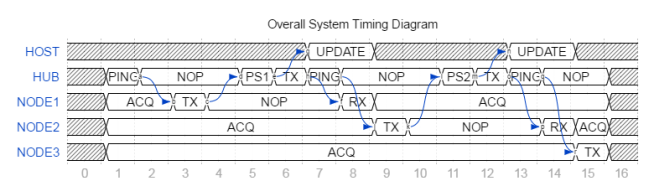
Since there are three sensor nodes that will be communicating with the central hub, it is impossible for them to send the data all the time. So, in order to solve this problem, the transmission is controlled by central hub. The overall system timing diagram is shown as the figure below. At frame 1, the hub starts to ping (PING) the node 1, and at the same time all three nodes start to acquire data from various sensors. Once the node 1 acknowledge and data is ready, it will transmit (TX) the data back to the hub for processing (PSx). After host PC processed the data, it will send data packet to the Host PC to update the data monitoring dashboard. When the central hub completes for one node, it will repeat the same process for the subsequent node.
To send the data from CT-ARM to Host PC, all the sensor measurements are packed into a self defined string format. ‘$’ is used as the header of the string while the end of string is terminated by the ‘\r\n’ character. The first info in the data packet is the node address identifier, which will be used by the vi to identify which packet received does it belongs to. The rest of the string contains all the measured value processed at the central hub.

To create the user interface, there are several tools available such as Visual Studio, Serial monitor of Arduino and etc. However, this project uses LabVIEW due to several reasons. LabVIEW is an easy tool that can be used to create a user interface to view data. Besides, it also has various drivers and tools available to interface between PC and hardware. Another highlight of LabVIEW is that graphical programming is used, unlike any other conventional text based programming. This powerful tool commonly used by the engineers in industry to solve complex engineering challenge.

To read all the serial data coming into the COM port of PC, VISA driver is used. VISA is a driver that is used to provide programming interface between hardware and development environment. Using the string functionality from Labview, the data packet sent by the CT-ARM can be easily breakdown into individual information.
The image above shows how the front panel looks like. Brief descriptions of each section as below:
#1 Three meter indicator is used to show the state of water level from each node.
#2 Sensor node indicates which node that has detected an error.
#3 Boolean indicator to show which error warning is detected.
#4 Real time display and serial monitor similar to Arduino is created to view the data coming in.
#5 Three graphs to display each axis accelerometer reading. Within each graph, 3 waveform displays the reading from each node.
#6 Graph to display the load cell reading from each node.
If you are interested to look into the code and build your own bridge monitoring system, the project files for Labview and Arduino is available at https://github.com/zxlee/bridge-monitoring-system .
The prototype for sensor node and central hub are all built on breadboard as shown in the images below.


The image below shows that when the accelerometer reading exceed a defined threshold, the sensor node status will indicate which node is in danger and also display which warning is detected. In this case, the sensor node 3 x axis reading which can be seen from the lower left graph has exceeded the threshold.

The second image shows that tsunami warning is detected. Based on the water level monitoring (upper left) section, sensor node 2 is in the critical level (3) and warning is issued and the gate is closed.

Last but not least, the reading from load cell is used to determine the bridge/structure health which is shown in the graph at the lower right. Whenever the reading exceeded the safe level, it is detected as a warning and the structure warning will turn red.

There are so many new things that I have learnt from this project. This was the first time I actually involved in a project which requires multiple processor communicate with each other through wireless communication. Besides it was also my first time to interface between an Arduino and LabVIEW which allows me to create a nice GUI easily and visualise all the sensor measurement. I hope this covers all the details for you to understand about this project. If you have any questions to know more about this project, feel free to drop me a comment below.
Last but not least, I would like to thanks to all my team members and also friends who gave their support to this project.


Cool project! Does the RF24 library implements anti-collision?
Hi John, I am not too sure about this as I did not go these details. Let me get back to you if I found any details about it.
Cheers!
Dear Lee, can you please share me the project files?
Hi Muhammad, I have just updated the article with a link to project files at github.
Here is the quick link: https://github.com/zxlee/bridge-monitoring-system
Cheers!
Dear Lee,
I am highly obliged.
Regards,
Adeel
Hi Adeel, you are welcome. I hope you will find the files useful to you.
Can you explain the process of sensing sensor and the calculation process sensor ADXL335 (step by step)?
I have read, that pin AREF in arduino can be use as function ADC. How your opinion about pin aref? do use pin aref, we don’t need to do the calculation on ADXL335?
The output of ADXL335 is in analog voltage form, the easiest way to measure the reading is to use the analog input pin of Arduino to read it.
The AREF pin is slightly different that is it not an ADC actually, but it is a pin for you to provide external reference for your ADC. However, in most cases, if external reference is not needed, you can use the default internal reference of Arduino for your AnalogRead() purpose.
I found this tutorial quite useful to explain on the AREF of Arduino, check it out http://tronixstuff.com/2013/12/12/arduino-tutorials-chapter-22-aref-pin/ . Hopefully it answers your question.
Okay thanks..
do you have reference or sourcode about sending sensor ADXL335 use nrf24l01 or Xbee s2 or esp8266?
I do not have reference code specifically using ADXL335 with nRF24L01, XBee or ESP8266. You may try to acquire the reading from ADXL335 first, then try to look for examples online on how to send the data wirelessly.
Reblogged this on Người Đến Từ Bình Dương.
Well done zxlee and thanks for outsourcing the results… I hope to give my contribution to projects like this in the future..